Introduction
Distillation is a useful and widespread method for separating a liquid mixture of two or more species. In this lab, a continuous rectification unit will be used to separate an ethanol (1) - water (2) mixture.
Pre-Lab Questions
You can download the Pre-Lab questions for this experiment here.
Background
We use a G.U.N.T. CE 600 system fitted with a column of six sieve trays for a total of seven separation stages (six trays plus a reboiler). The relevant PFD may be downloaded here, and useful density tables for determining mass fraction as a function of density and temperature may be found here.
Theory
Non-Ideal Isothermal Flash
A non-ideal, isothermal flash calculation will allow you to estimate the liquid-vapor composition using thermocouple data; wherever possible, this estimate should be compared to gravimetric measurements using tabulated data (see below). Recall the Gibbs Phase Rule,
\[F = N - \pi + 2\]
where \(F\) is the degrees of freedom, \(C\) is the number of components, and \(\pi\) is the number of phases. For a two-component system in a flash drum at equilibrium, the phase variables are pressure \(P\) and temperature \(T\), assumed to be uniform, and \(N-1\) mole fractions in each phase (\(x_i\) for liquid, \(y_i\) for vapor). Since \(N = \pi = 2\), \(F=2\) and any two of \(T,P,x_i\) or \(y_i\) are sufficient to fully specify the system. The unknown variables are solved by means of a flash calculation,[1][2] which for a binary system requires iterative solution of
\[x_1 = \frac{1-K_2}{K_1-K_2}\]
where \(K_i = y_i / x_i\) is the equilibrium ratio of species \(i\). Note that modified Raoult's Law is required to accurately capture the non-ideal behavior of the ethanol-water system; the form we use is
\[K_i = \frac{\gamma_i P_i^{\textrm{sat}}}{P}\]
where \(\gamma_i\) is the activity coefficient of species \(i\), and \(P_i^{\textrm{sat}}\) is the saturation (vapor) pressure of component \(i\). The Antoine equation can be used to determine \(P_i^{\textrm{sat}}\) as a function of temperature; several models are available to estimate \(\gamma_i\). For simplicity, the Margules model is recommended wherein activity coefficients are estimated as
\[\ln \gamma_1 = x_2^2 \left[ A_{12} + 2\left(A_{21}-A_{12}\right)x_1\right]\]
and
\[\ln \gamma_2 = x_1^2 \left[A_{21} + 2\left(A_{12}-A_{21}\right)x_2\right]\]
where \(A_{12}\) and \(A_{21}\) are experimentally determined coefficients. For the ethanol (1) - water (2) system, \(A_{12} = 1.6022\) and \(A_{21} = 0.7947\). Other useful techniques include the van Laar, Wilson, and UNIQUAC models for which details and parameters may be found elsewhere.[3] Iterative solutions of Eqs. (2) and (3) are required to produce T-x-y and x-y diagrams.
McCabe-Thiele Graphical Analysis
The McCabe-Thiele graphical method is described in detail elsewhere; here, we summarize a few relevant points to get you started. Recall that an XY diagram is required with lines for equilibrium and diagonal. You can use a flash calculation to determine the equilibrium curve or find experimental data and interpolate as needed; schematically, a plot for ethanol - water should look similar to that shown in Figure 1.
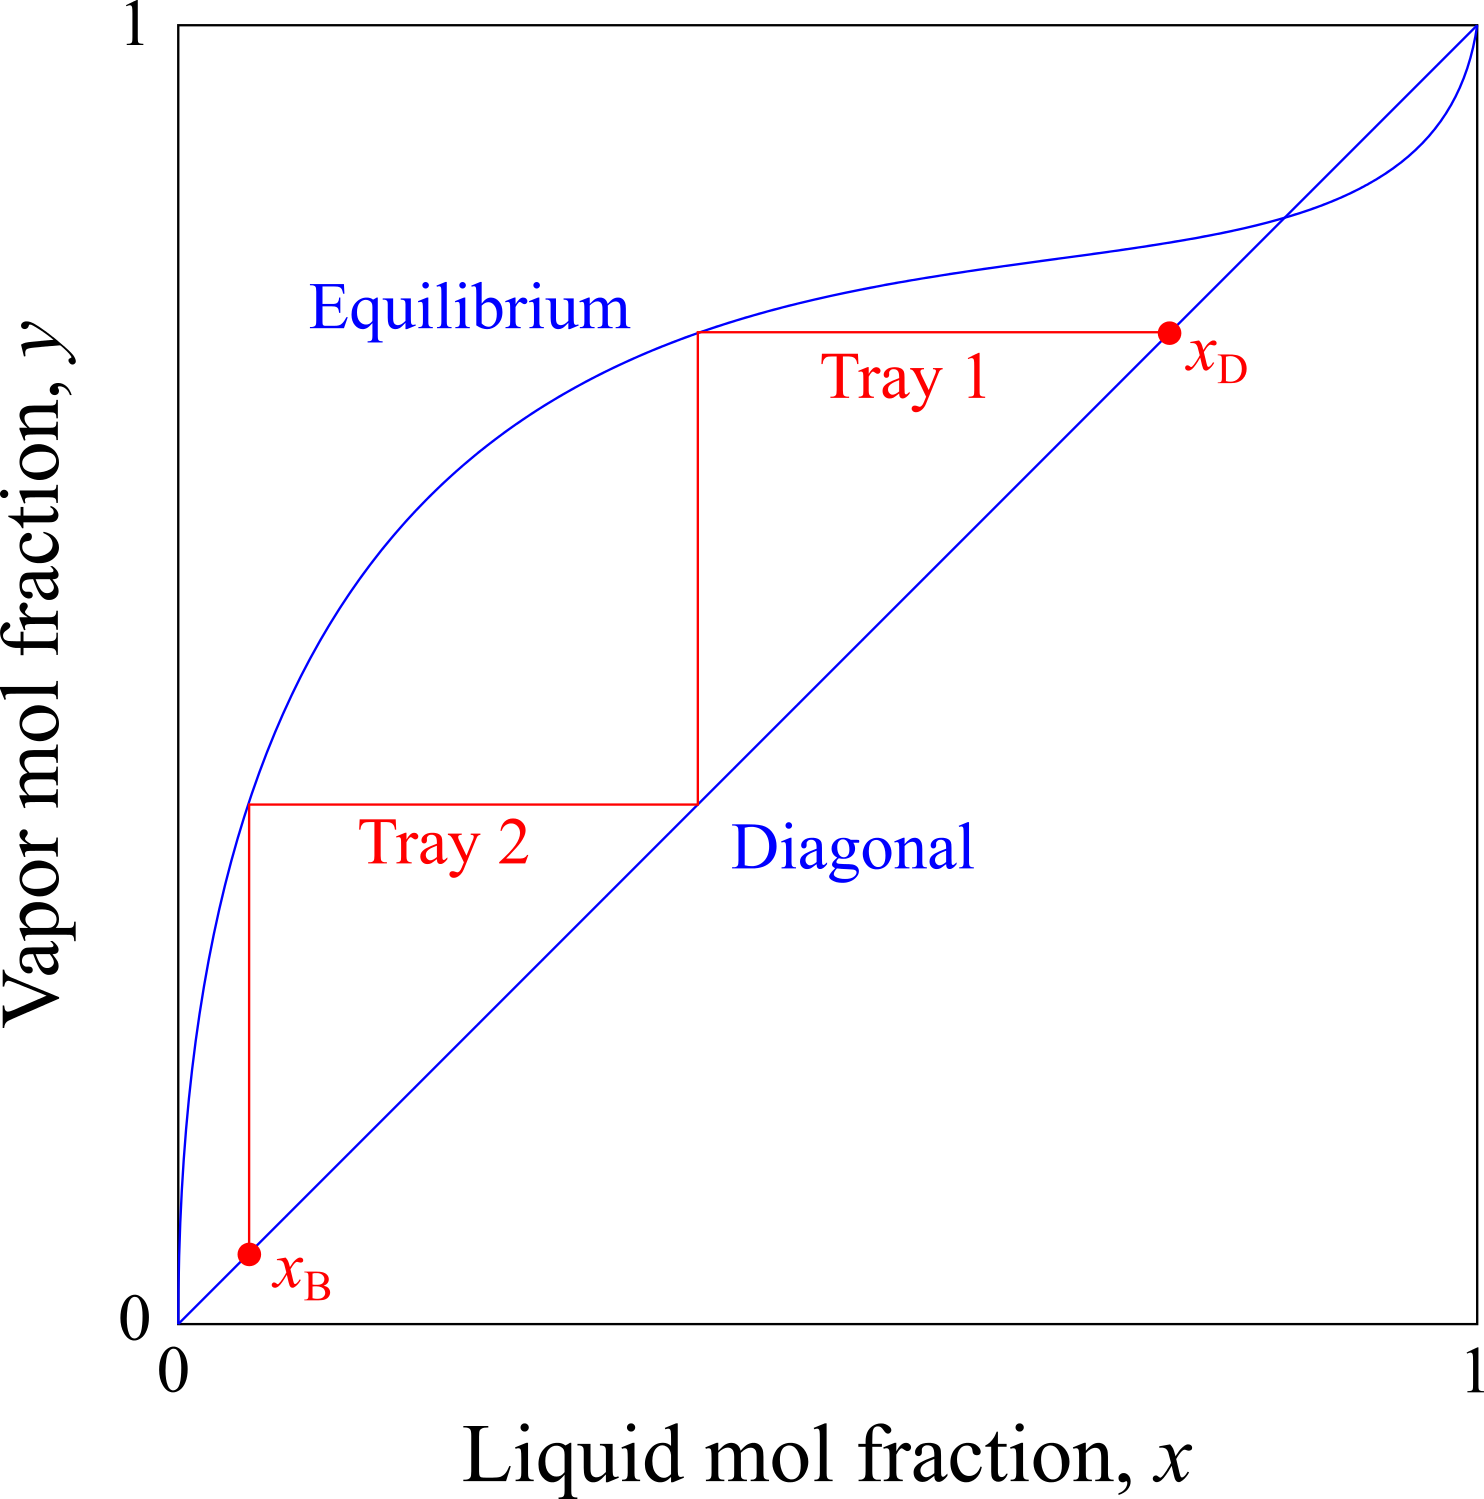
Figure 1. Approximate XY diagram for the ethanol (1) - water (2) system. All concentrations are mole fractions; the upper line is the equilibrium line and can be determined by flash calculation or equilibrium data; the diagonal lines is for reference.
Murphree Efficiency
Of several ways to evaluate tray efficiency the Murphree efficiency \(\eta_M\) is perhaps the most intuitive and is defined as
\[\eta_M = \frac{y_n - y_{n+1}}{y_n^* - y_{n+1}},\]
where \(y_n\) is the actual concentration of vapor leaving plate \(n\), \(y_{n+1}\) is the actual concentration of vapor entering plate \(n\), and \(y_n^*\) is the concentration of vapor in equilibrium with the liquid leaving plate \(n\). Put another way (and by no less than Warren McCabe himself),
[t]he Murphree efficiency is therefore the change in vapor composition from one plate to the next divided by the change that would have occurred if the vapor leaving were in equilibrium with the liquid leaving.[4]
The situation is somewhat clarified by Figure 2 which illustrates that the vertical "step" of the McCabe-Thiele diagram falls somewhat short of the equilibrium value.

Figure 2. Approximate XY diagram for the ethanol (1) - water (2) system. All concentrations are mole fractions; the upper line is the equilibrium line and can be determined by flash calculation or equilibrium data; the diagonal lines is for reference.
There is only a single Murphree efficiency for a given column but there are (at least) two different and equivalent ways to determine the Murphree efficiency given the number of plates as well as the top and bottom compositions at steady state:
- Perform the McCabe-Thiele "step" method as usual from \(x_B\) to \(x_D\) but for each vertical step first calculate \(y_n^*\) and only step vertically the height implied by the Murphree efficiency equation above. Vary \(\eta_M\) until \(x_D\) is achieved.
- Calculate an effective equilibrium curve using \(y_e^{\prime} = y + \eta_M\left(y_e - y\right)\) to replace the actual equilibrium vapor composition \(y_e\) and perform the McCabe-Thiele "step" method as usual but step to \(y_e^{\prime}\) instead of \(y_e\).
Minimum Reflux Ratio
Calculate \(R_{\textrm{min}}\) in a manner similar to the graphical "pinch point" method used for continuous systems with feed.
Constant Reflux
The cumulative distillate composition \(\bar{x}_D\) after some time \(t_f\) may be estimated by first determining the number of theoretical plates, then applying the approximate method developed by Smoker and Rose[5] for binary batch distillation. An excellent introduction to this method is provided Seader[6] and may be viewed here. Specifically, you should work Example 13.4 before attempting constant reflux operation in order to record the appropriate variables. Another example may be found in Perry's Handbook[7] and is particularly relevant since it refers to the ethanol - water system. You can also review the tutorial below for additional clarification.

UC San Diego - CENG 176 - Smoker Rose
Video 1. Derivation and tips for the Smoker-Rose analysis of our batch distillation unit.
In order to expedite the complex calculations used not just for the smoker-rose lab, but for batch distillation as a whole, we've created an excel tutorial that will cover many useful tools that can be used to recreate the spread sheet in the Smoker Rose video above. That resource can be found here.
Standard Operating Procedure
Safety
- The continuous rectification column has several hot surfaces. Use caution when working near the column to avoid contact.
- The ethanol in the tank has been denatured meaning that however desperate you are to get through the lab, drinking your distilled product will not get you done any faster. You will likely go to the hospital, it'll cause a big ruckus, I'll feel bad for a solid five or six minutes, and then I'll get irritated because of the loads of complicated paperwork you just made for me[8].
- Do not dispose of any solution down the drain! Return all samples to Tank VI for later re-use.
- Relevant chemical information has been listed in Table 1.
| NameMSDS | Formula | Hazard | Supplier | SKU |
|---|---|---|---|---|
| Ethanol (200) | CH3CH2OH | 
|
any | any |
Tutorial Video
Check out the video below for a brief overview of this experiment, then carefully read the instructions below. Keep in mind that there may be variations in the equipment or protocol when you're in the lab compared to when this video was created. Ask a TA or instructor if you're not clear on something.

Preparation
- Open both cooling water inlet and return valves (blue valves on the wall behind the unit) and turn on the booster pump with the red switch. This is a closed circuit cooling loop so make sure to open both valves at the same time so that tubing will not over-pressurize. Set water flow rate at 2.4 LPM to 2.8 LPM.
- Check the liquid level in the boiler. If it's less than 6 L, notify the TA or instructor and wait to proceed until it's filled.
- Turn on main power switch (red) and turn controller setting to "Remote."
- Open control software on laptop. On "Chart" tab, click "Settings" and choose an appropriate path for your saved data. Data will not record until red button with circular arrows is depressed on "Chart" tab.
Basic Operation
- Use the "System" tab within the control software to set the heater power to 4000 W (100%) and the reflux return ratio to 100%. Push the green button on the main control panel to turn on the heater, but do not press the green button for the reflux valves yet.
- Wait for a few drops of distillate to appear in the reflux drum, which should take about 20-30 minutes.
- Note: If the temperature in the boiler exceeds 98 degC before this happens, turn off the heater power and notify the TA or instructor because there's not enough ethanol in your system.
- When the first drops of distillate have appeared, press the green button to activate the reflux valves, and use the control software to reduce the heater power to about 350 W.
- Distillate will continue to accumulate in the reflux drum until it reaches to the top of the pipe stem, which corresponds to about 2 inches of liquid. Once the liquid reaches this level it should stabilize and never vary during the remainder of the operation.
- Once the reflux drum liquid level has stabilized, allow the system to run until it reaches steady state. Use the chart tab on the control software to monitor the stage temperatures and column pressure drop. Remember that the column pressure drop needs to be about 20 mbar; this can be adjusted to a limited extent by changing the heater power. Now is also a good time to ask a TA or instructor how to record system data if you haven't already done so.
- When steady state has been achieved, use the control software to set the reflux return ratio to the desired value. Be sure to set this value above your calculated \(R_{min}\).
- Distillate product will accumulate in Tank 5.
- Measure the cumulative volume regular time points by draining the tank into a graduated cylinder. Also measure the cumulative tank concentration by using the nearby 10 mL volumetric flasks.
- After the desired product volume has accumulated, or when the boiler temperature has exceeded 99 degC, the experiment is complete. Talk to a TA or instructor if you'd like to perform another experiment today or if you're ready to shut off the equipment.
A few additional points to keep in mind:
- To estimate ethanol composition in the distillate product tank,
- Clean, dry, and tare (if the mass is not already written on the bottom) one of the nearby volumetric flasks.
- Fill the flask to the marked line with the desired sample.
- Determine the density and temperature of your sample, then estimate ethanol composition from the provided density-concentration tables (which can be downloaded here).
- Note that if a sample is collected from the phase separation tank but not returned, your steady state will shift.
- Generally, the following run order is suggested:
- Day 1: Measure initial composition, reach steady state, and practice taking samples and performing flash calculations.
- Day 2: Measure initial composition (should be same or similar to Day 1), reach steady state, then set desired reflux rate (above \(R_{\textrm{min}}\)). Allow about 500 mL product to accumulate, measuring the appropriate variables based on constant reflux analysis routine.
- Day 3: Repeat Day 2 for a different reflux rate.
- Make sure the software isn't recording and the save file can be accessed BEFORE you shut off the main power! If the power is shut off while the software is still recording, it would result in a communication error and deletion of the current save file.
Shutdown
- Turn off heater.
- Turn off main power switch on controller.
- Close both cooling tower valves.
- Return all collected samples and drain all tanks into the left feed tank (Tank VI).
Common Report Mistakes and Suggestions
The evaluator(s) for this experiment was asked to list three or more common mistakes often made on the reports for this experiment, or to provide three or more suggestions that could improve the quality of reports for this experiment. The responses were as follows:
- Improper formatting of units (use \SI{}{}), variables (use math environments), and cross references (use \cref{}).
- Poor paragraph structure; use topic sentence structure to improve writing and make a cohesive story.
- Low-res or difficult to read plots and figures (use MATLAB to make good plots as described in the wiki).
- Regression and prediction intervals sometimes appear on plots for which there is no theoretical or empirical equation to be fitted.
- Fundamental misunderstandings of VLE: the entire mixture boils, never a single component; both components move in both directions within the column; there are no chemical reactions in our distillation column;
- There's no need to go into the details of a flash calculation because it's a basic tool of chemical engineering. Simply state that a flash was performed, note which thermodynamic model was used (e.g., modified Raoult's law with 2 parameter Margules activity model), and move on.
- When used properly, the Smoker-Rose method cannot give negative distillate compositions or distillate compositions greater than 100%.
References
- ↑ Van Ness, H., Abbott, M. In: Perry's Chemical Engineers Handbook, Green, D., Perry, R., Eds., 8th ed.; McGraw Hill: New York, 2008, Ch. 4
- ↑ Doherty, M. et al. In: Perry's Chemical Engineers Handbook, Green, D., Perry, R., Eds., 8th ed.; McGraw Hill: New York, 2008, Ch. 13.
- ↑ ibid.
- ↑ McCabe, W.L.; Smith, J.C.; Harriott, P. Unit Operations of Chemical Engineering, 7th ed. McGraw-Hill: New York, 2005. pp. 712-722.
- ↑ Smoker, E.; Rose, A. Trans. AIChE, 1940, 36, 285-293.
- ↑ Seader, J.; Henley, E.; Roper, D. Separation Process Principles, 3rd Ed., John Wiley & Sons: Hoboken, NJ, 2011; Ch. 13.
- ↑ ibid, p 112.
- ↑ Seriously, have you seen the paperwork from hospitals? Even the CEO of United Healthcare couldn't understand the bill his own company gave a patient. And now you want to put me through that? I shouldn't have told you it was denatured in the first place with an attitude like that. Jerk.